RVA Gallery
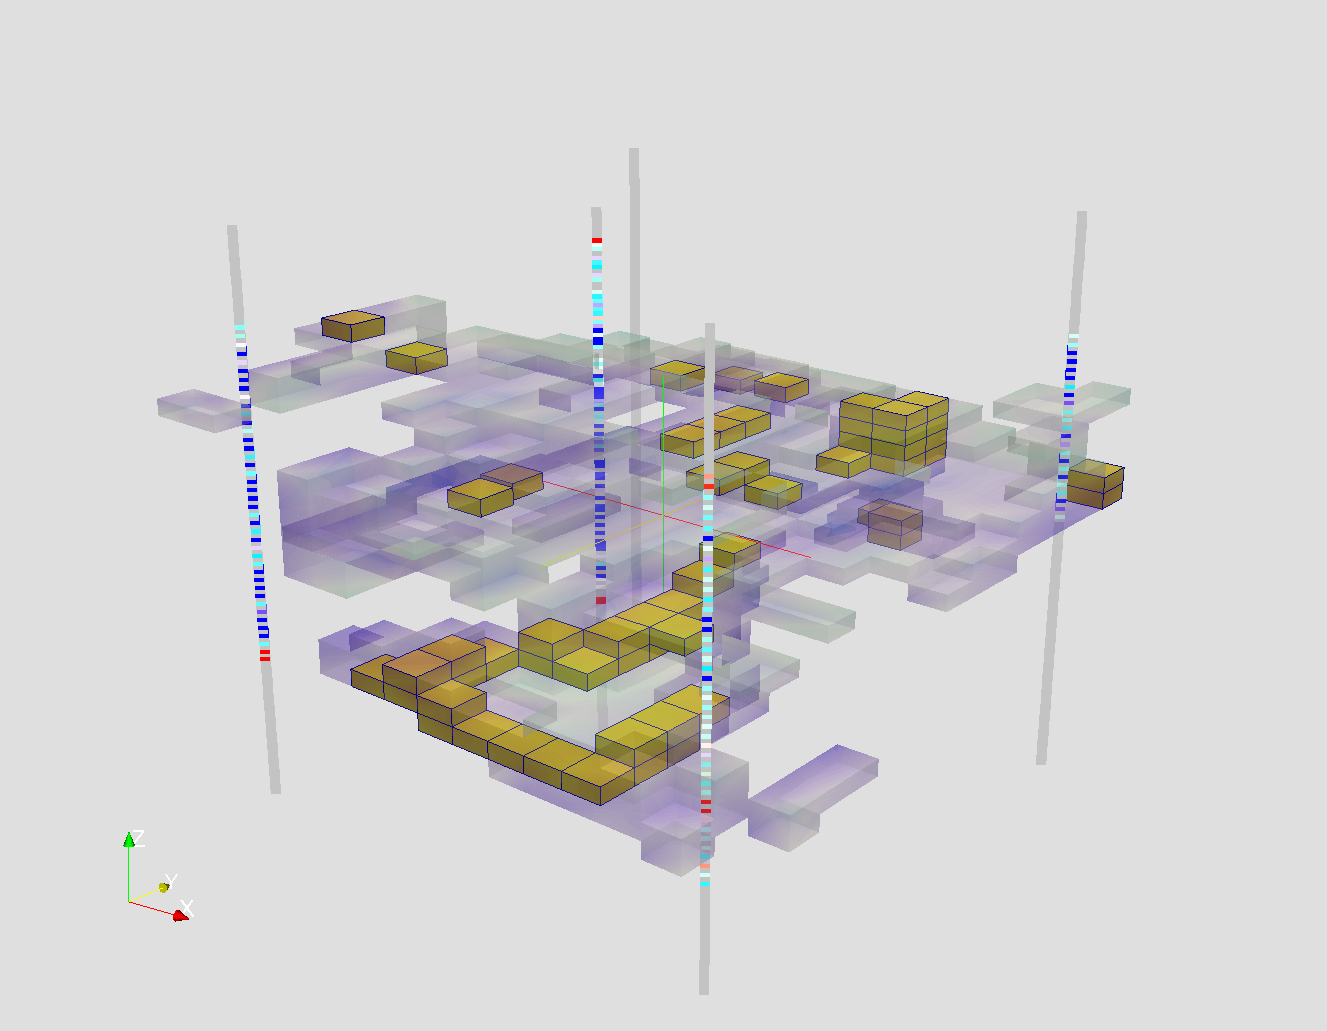
High porosity levels are shown here in various shades of purple with high permeability shown in gold. The boreholes here show porosity of core samples.
Low porosity is shown here in a gradient to high porosity as blue to green to red. Gold dots indicate the highest permeability zones. The boreholes here show normalized SP geophysical data.
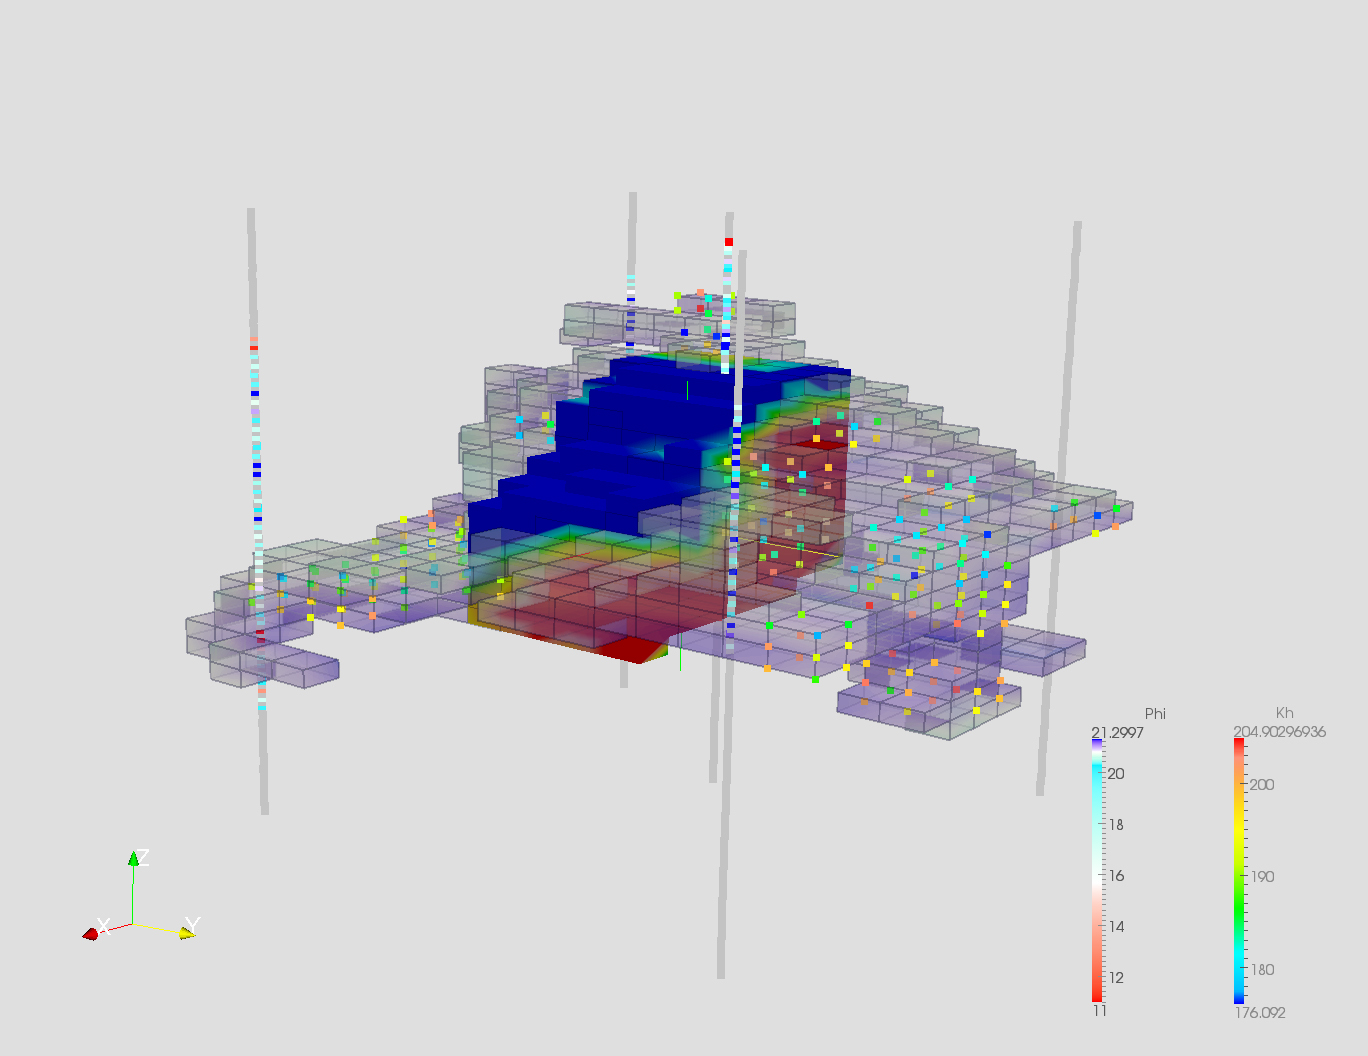
Here, the purple blocks indicate high porosit corresponding with the color ramp on the left while colored dots indicate permeability corresponding to the color ramp on the right. The boreholes here show perosity from core samples.
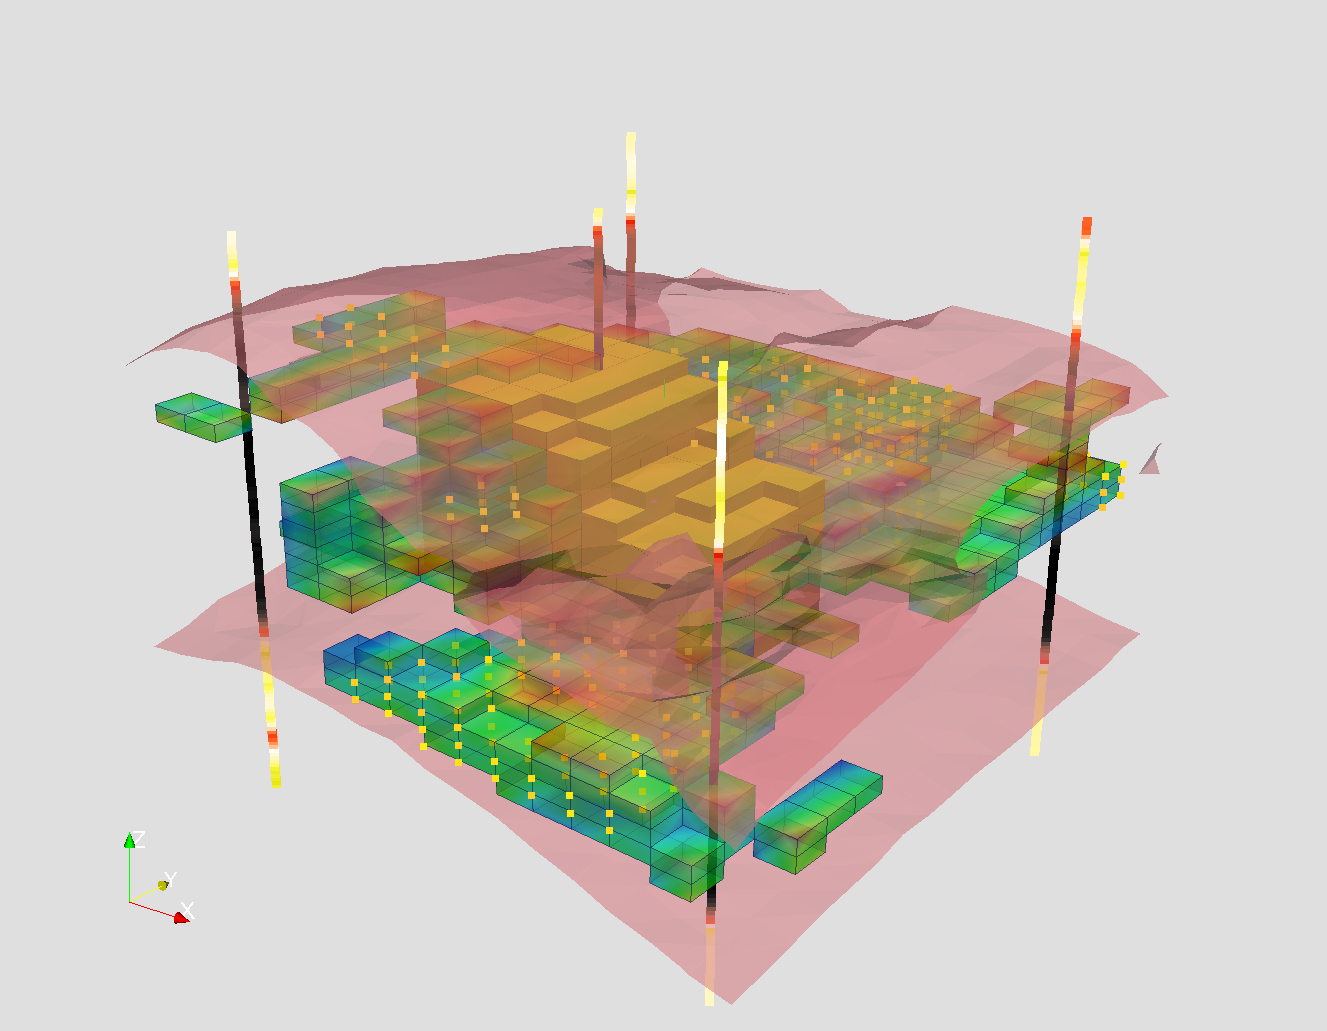
Red surfaces indicate an isosurface with permeability equal to 100mD (milliDarcy). High porosity is shown from low to high as from blue to green to red. Gold blocks indicate a subset of the reservoir with high permeability and golden dots show permeability greater than 115mD. The boreholes here show normalized SP.
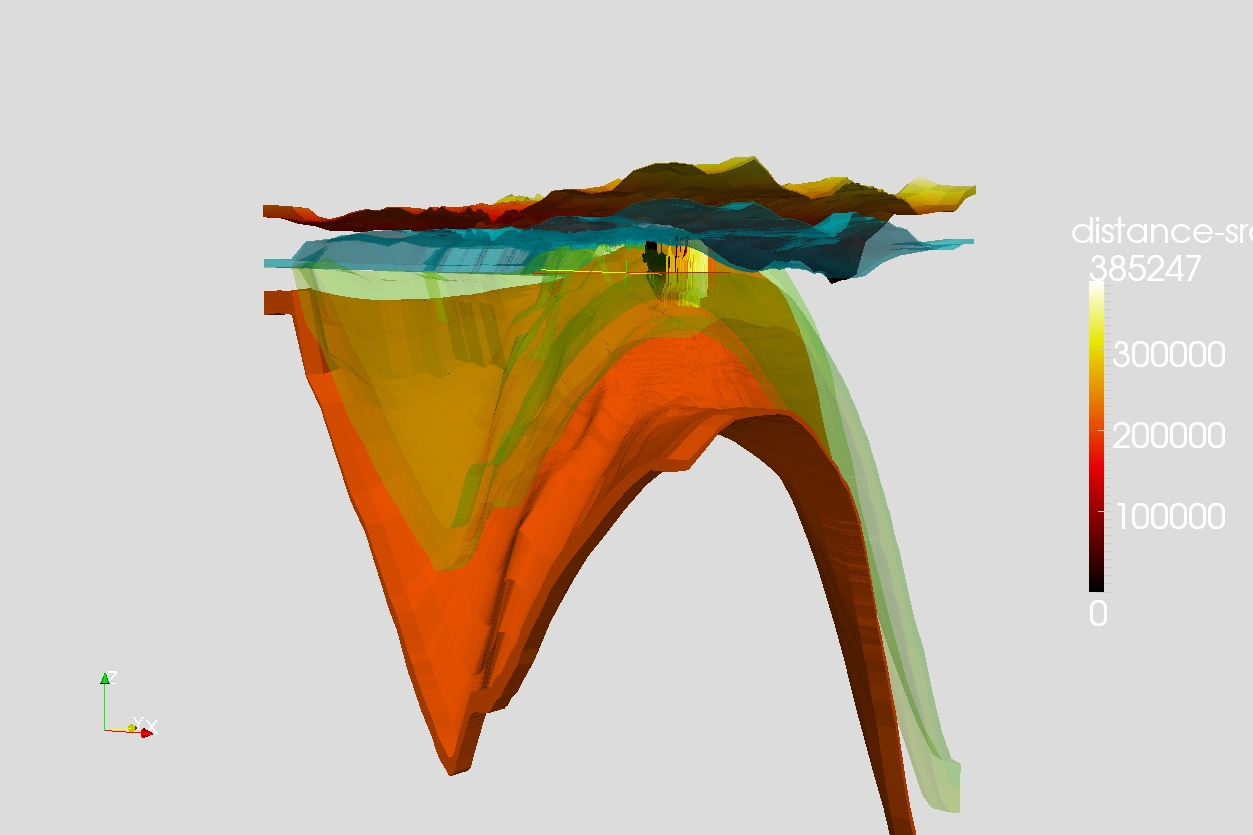
This is a regional 22 layer geological model. Colors indicate individual layers with the color ramp indicating distance along flow paths.
This is a regional flow model highlighting two geological layers. Fluid flow paths are highlighted with a color indicating the distance from the origin.
Shown here is a reservoir sweet zone shaded by permeability. Boreholes show normalized geophysical logs.
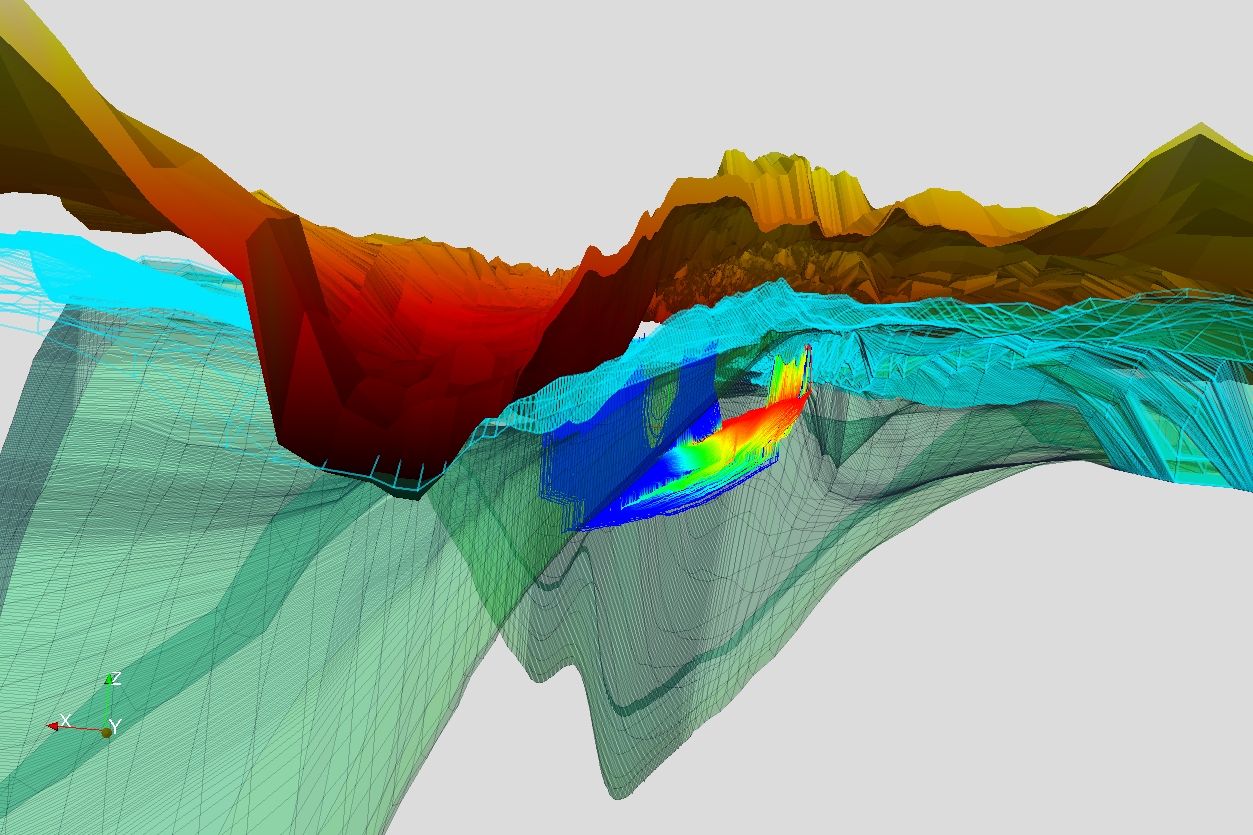
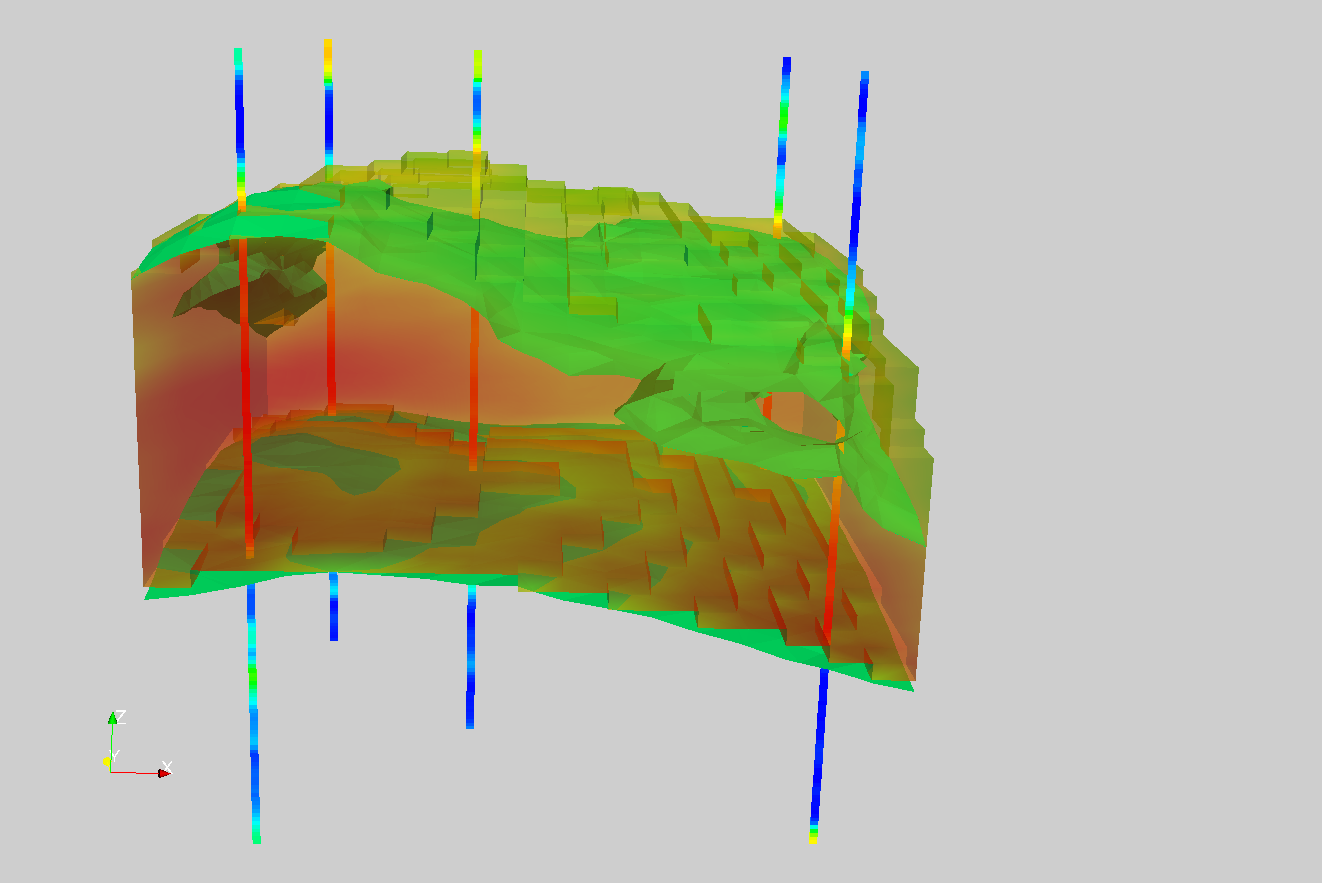
This is a regional flow model showing 6 of 22 total layers. The upper surface shows the North Eastern quadrant of Lake Michigan. Colors indicate each individual layer.
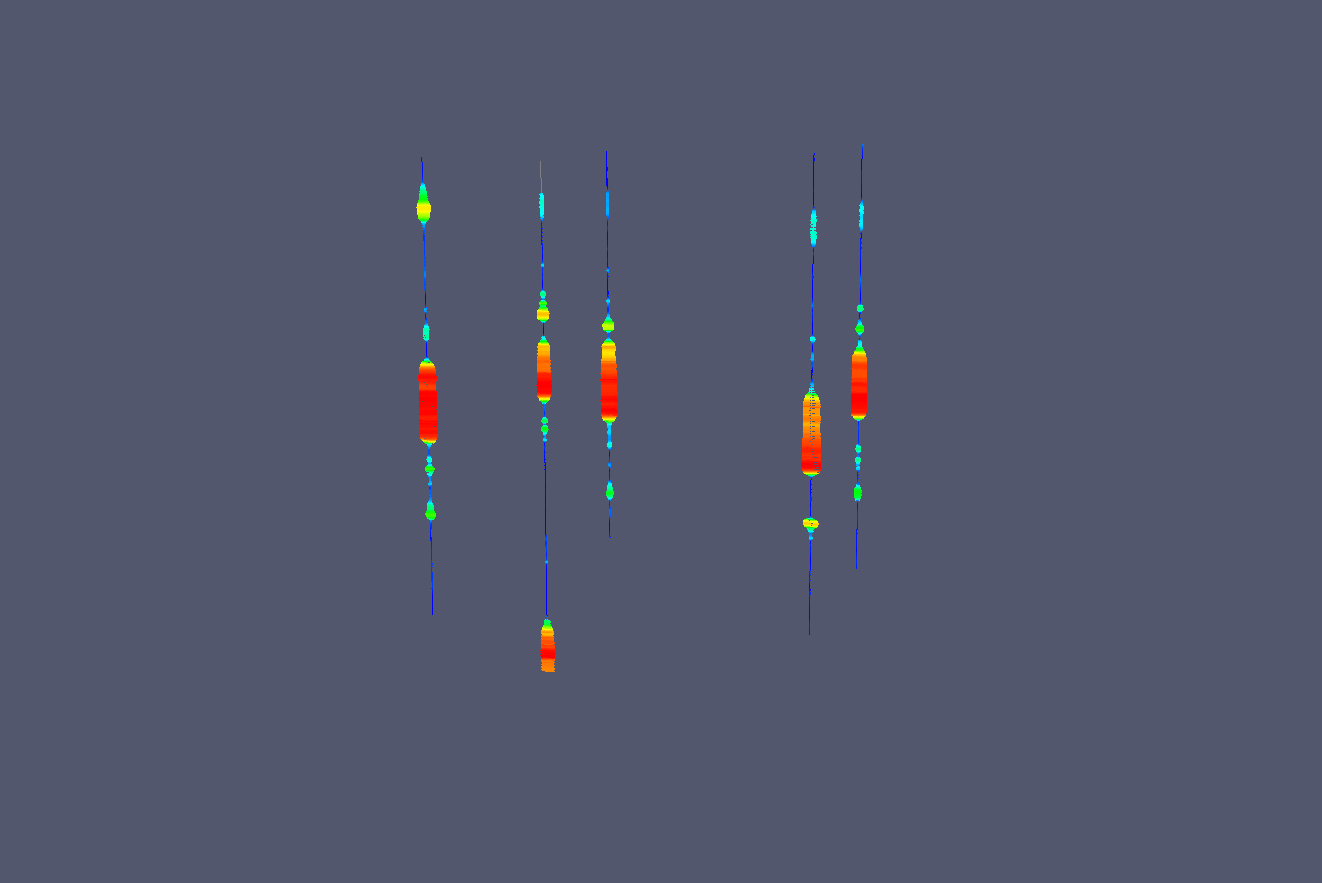
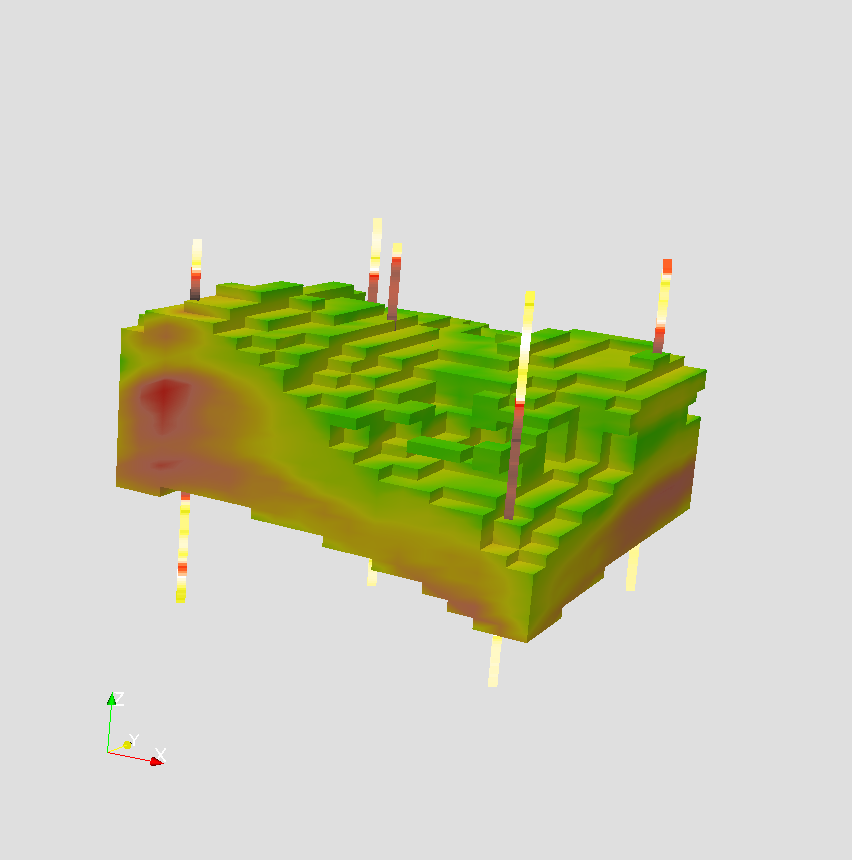
These are borehole loge rendered using glyph options. Color and width correspond with higher values of normalized SP data.
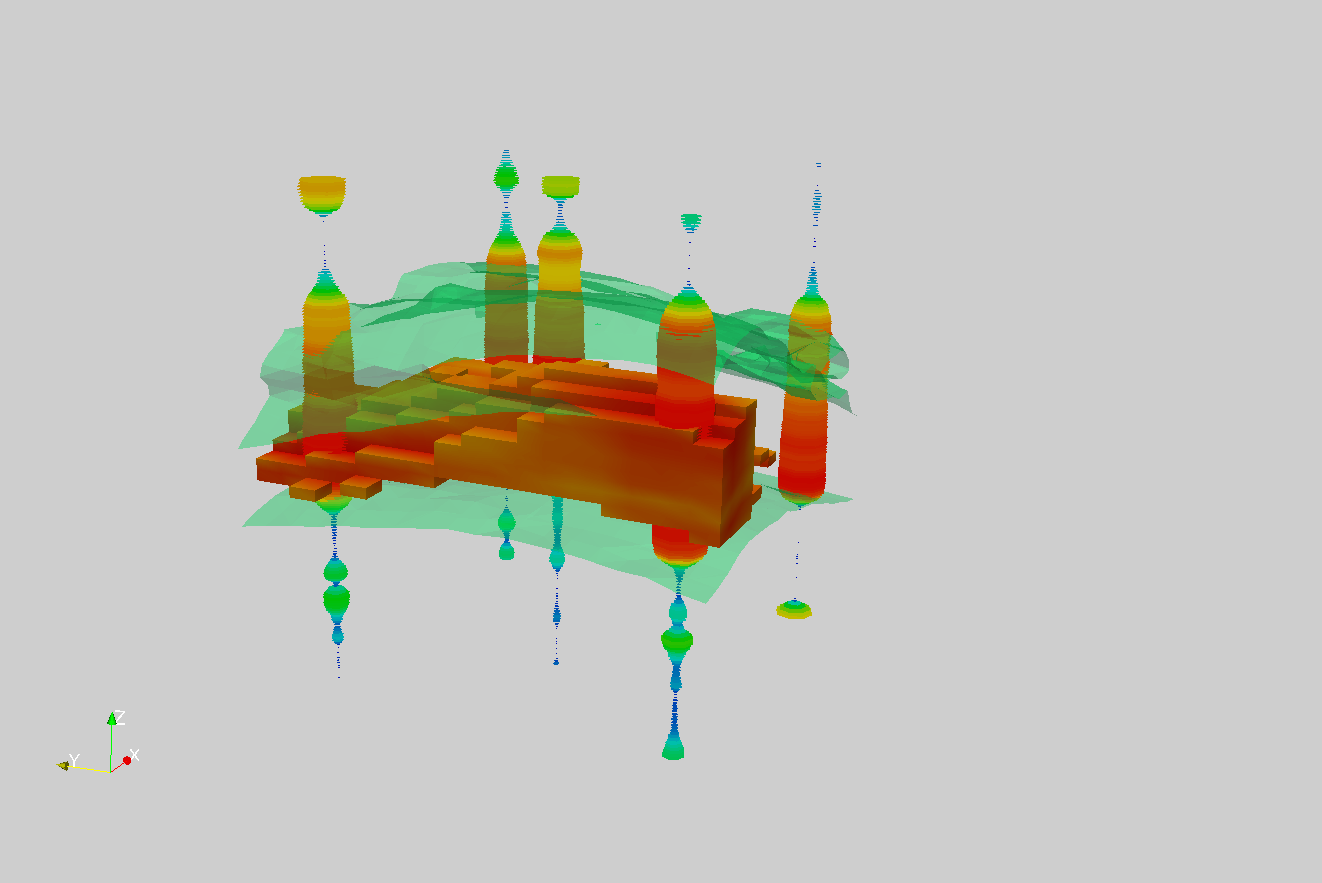
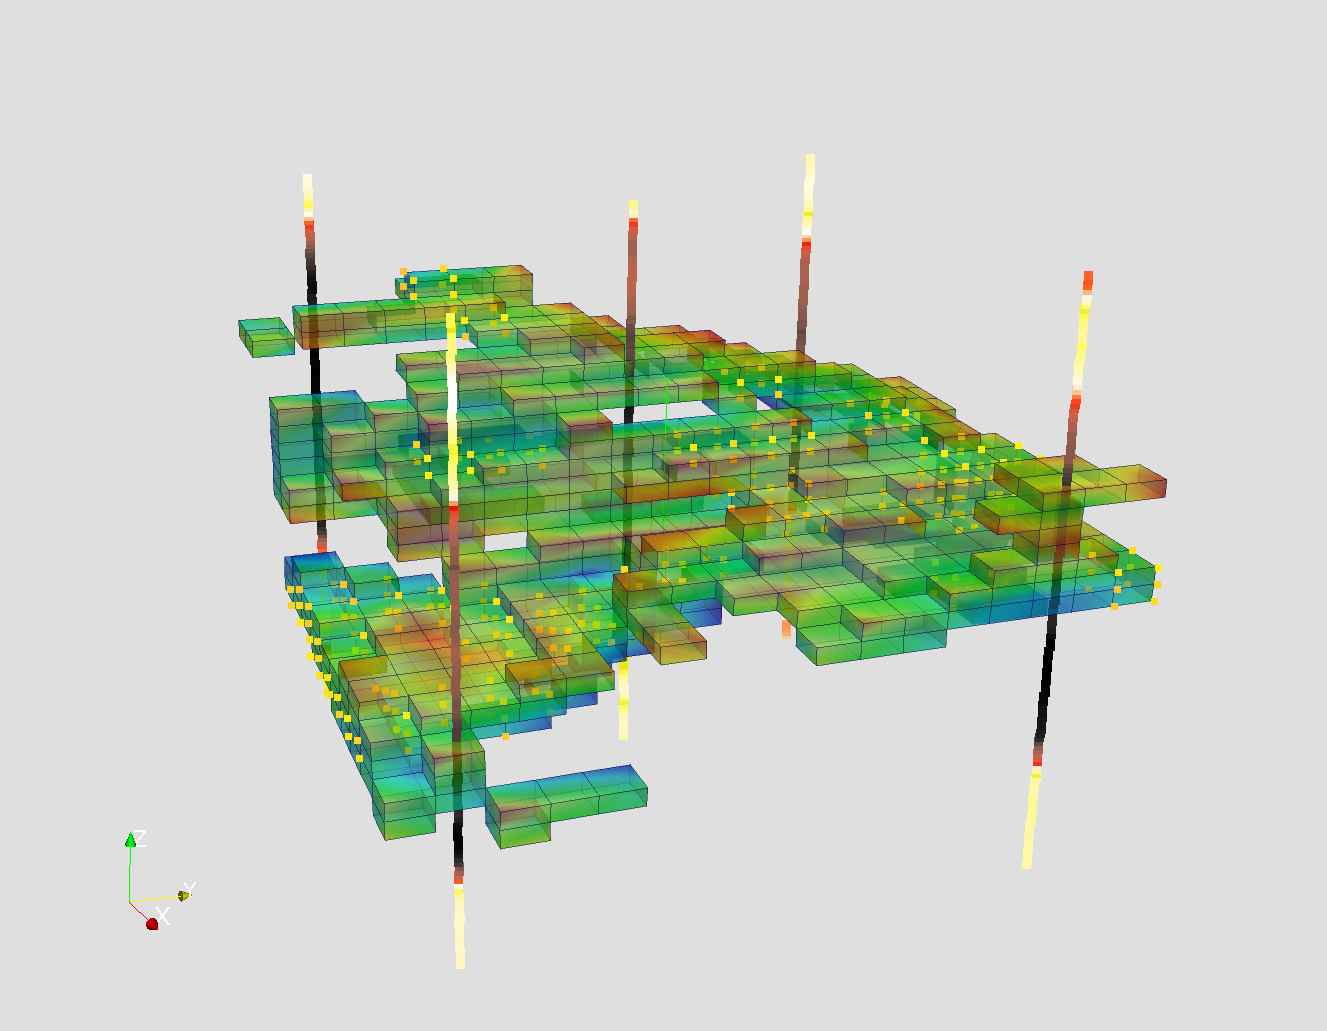
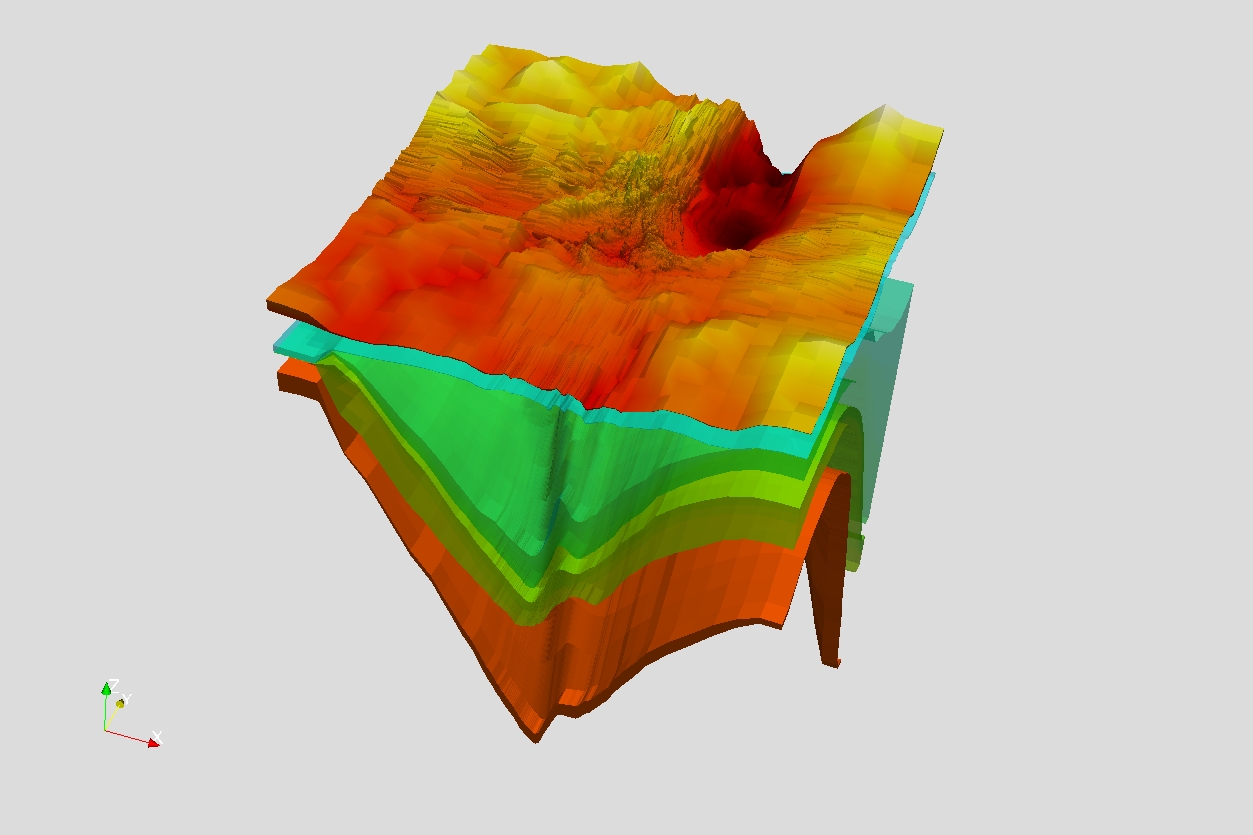
Green surfaces indicate 100mD (milliDarcy) isosurfaces. Orange blocks correspond with permeability values greater than 120mD. Boreholes here show normalized SP using glyph options.
The translucent volume represents porosity value greater than 20%. The boreholes are colored for permeability.